Analytics & Reporting
Real-Time insights and traceability across your quality pipeline
Track requirements coverage, test results, and defect trends across your pipeline. Make confident release decisions with objective data, instead of depending just on gut feelings & experience.
Design Dashboard
Requirement Traceability Dashboard
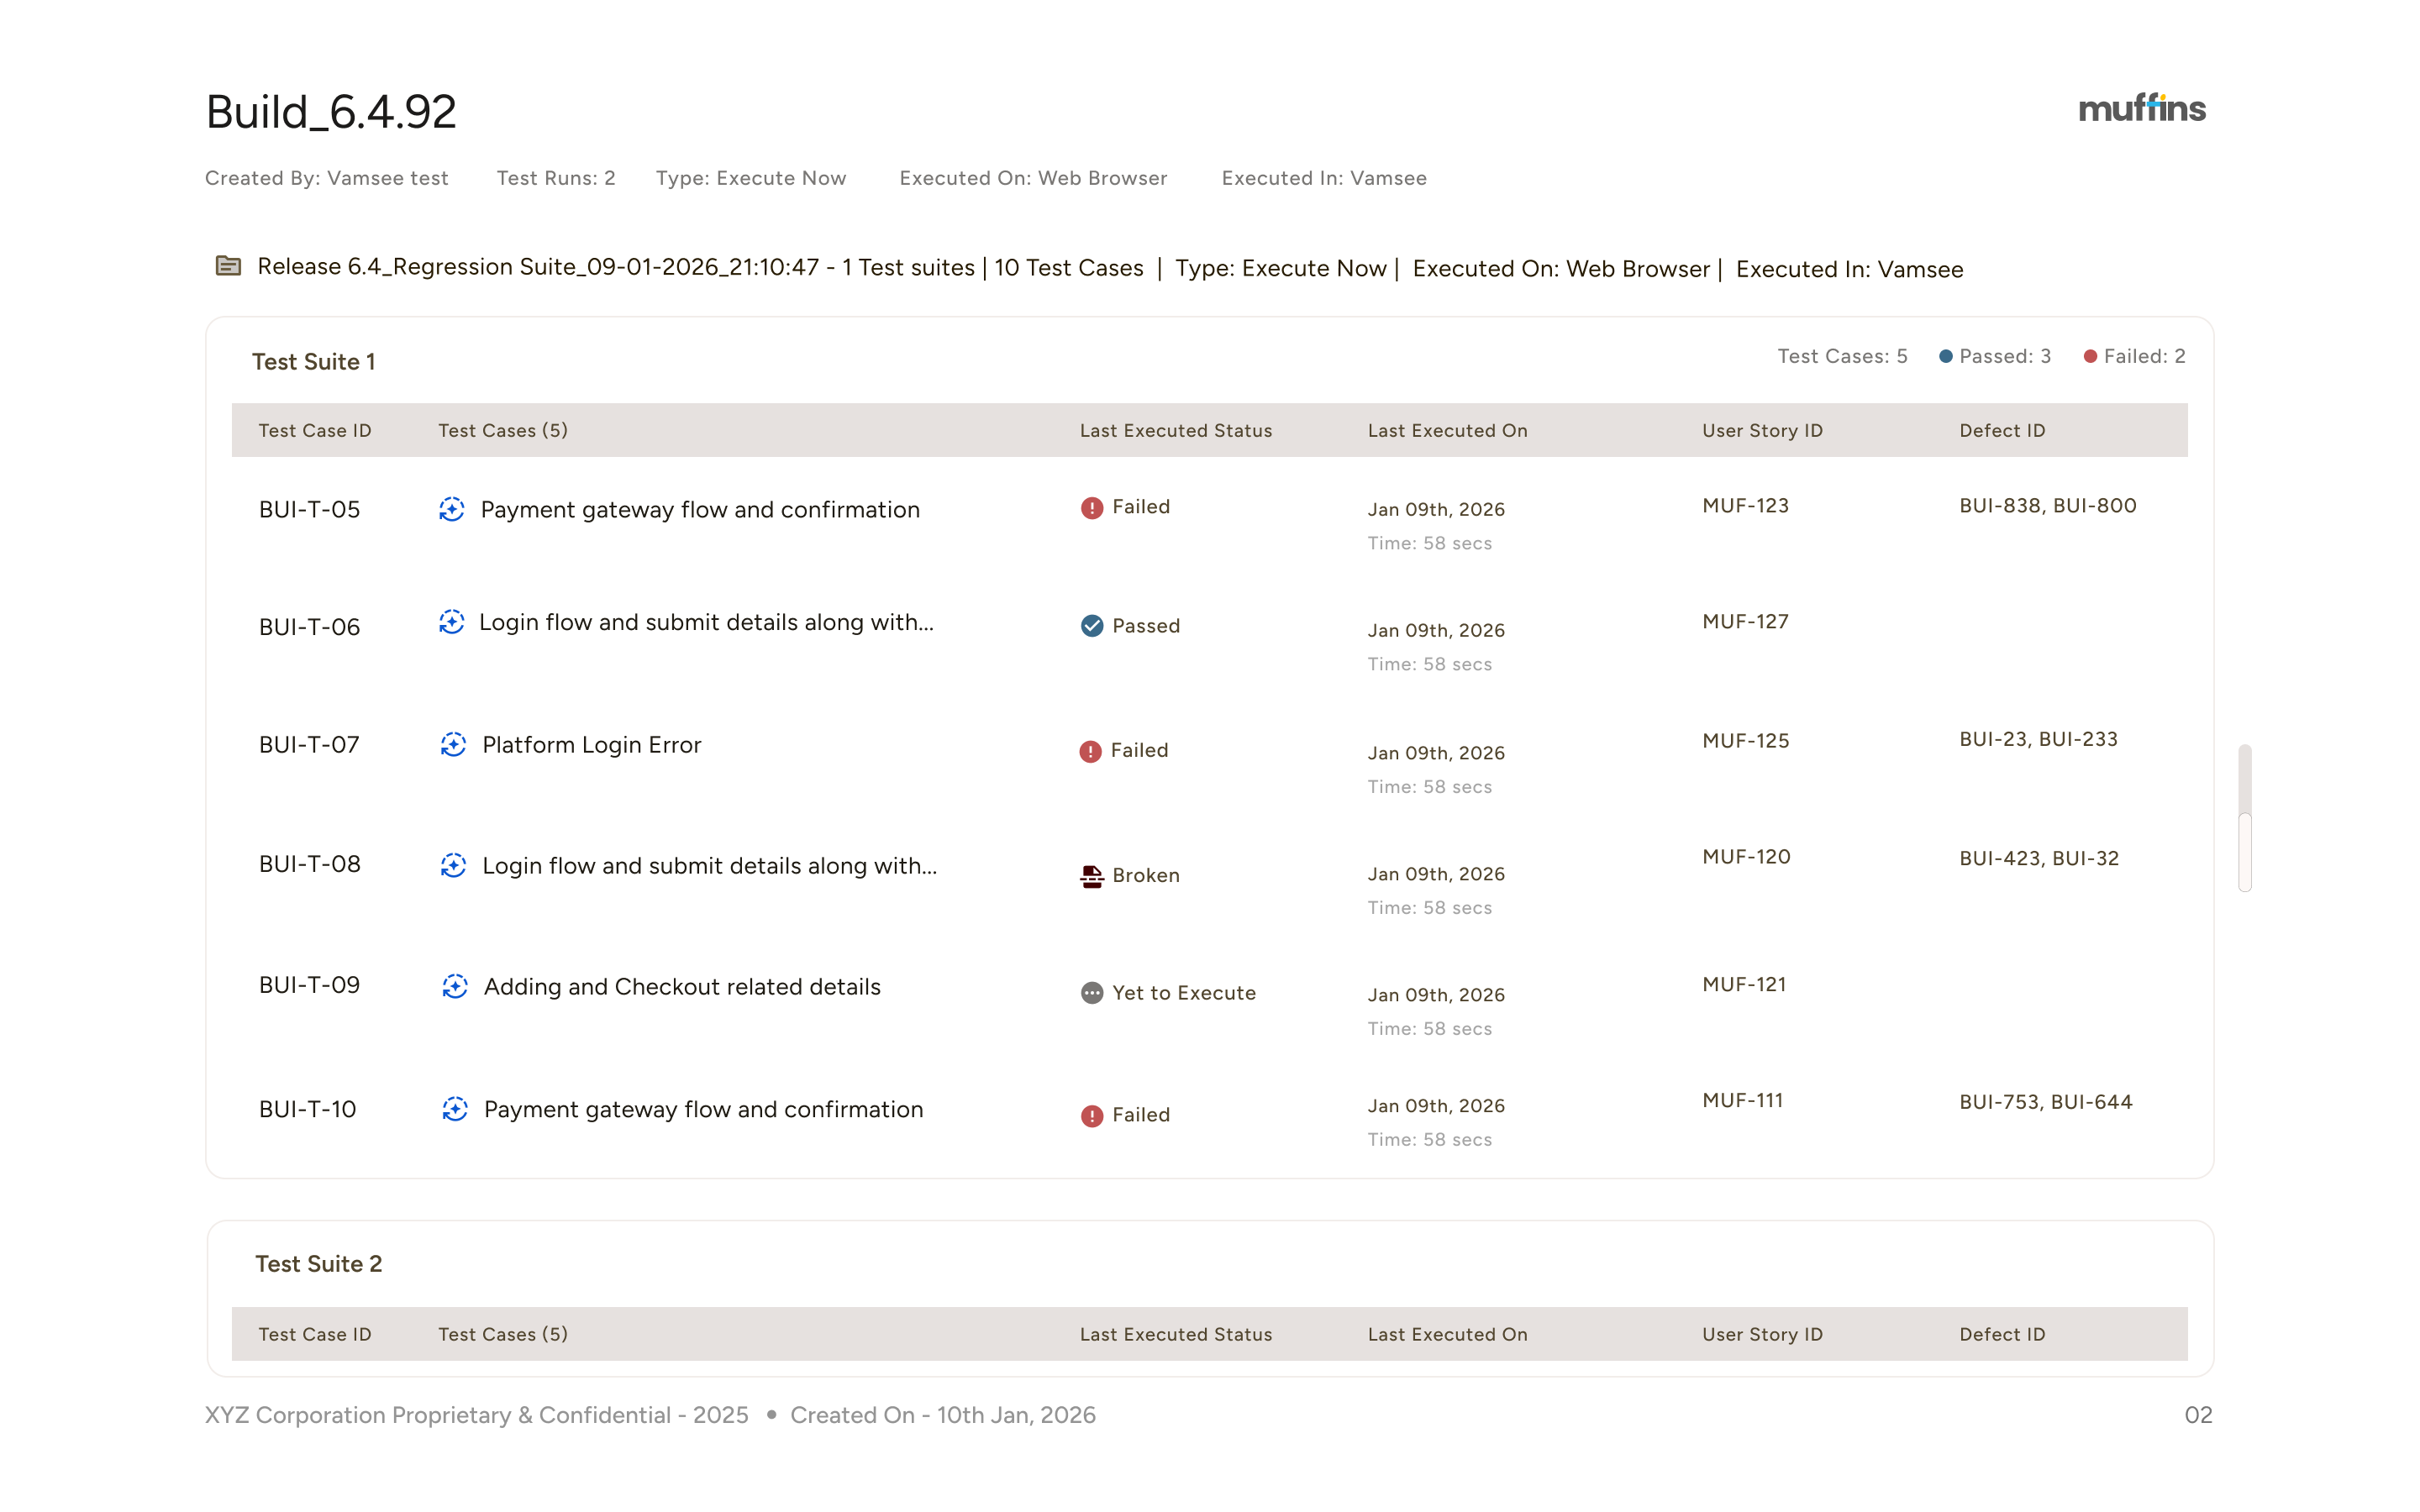
Execution Dashboard
Defect Dashboard
Total cases, Automated vs Manual, Progress by team or by tester
Each requirement mapped to its test cases, Automation status, Execution history
Live view of test runs, Pass/Fail, Regression impact
Defects, Re-tests, Resolutions
Capabilities
Core Capabilities
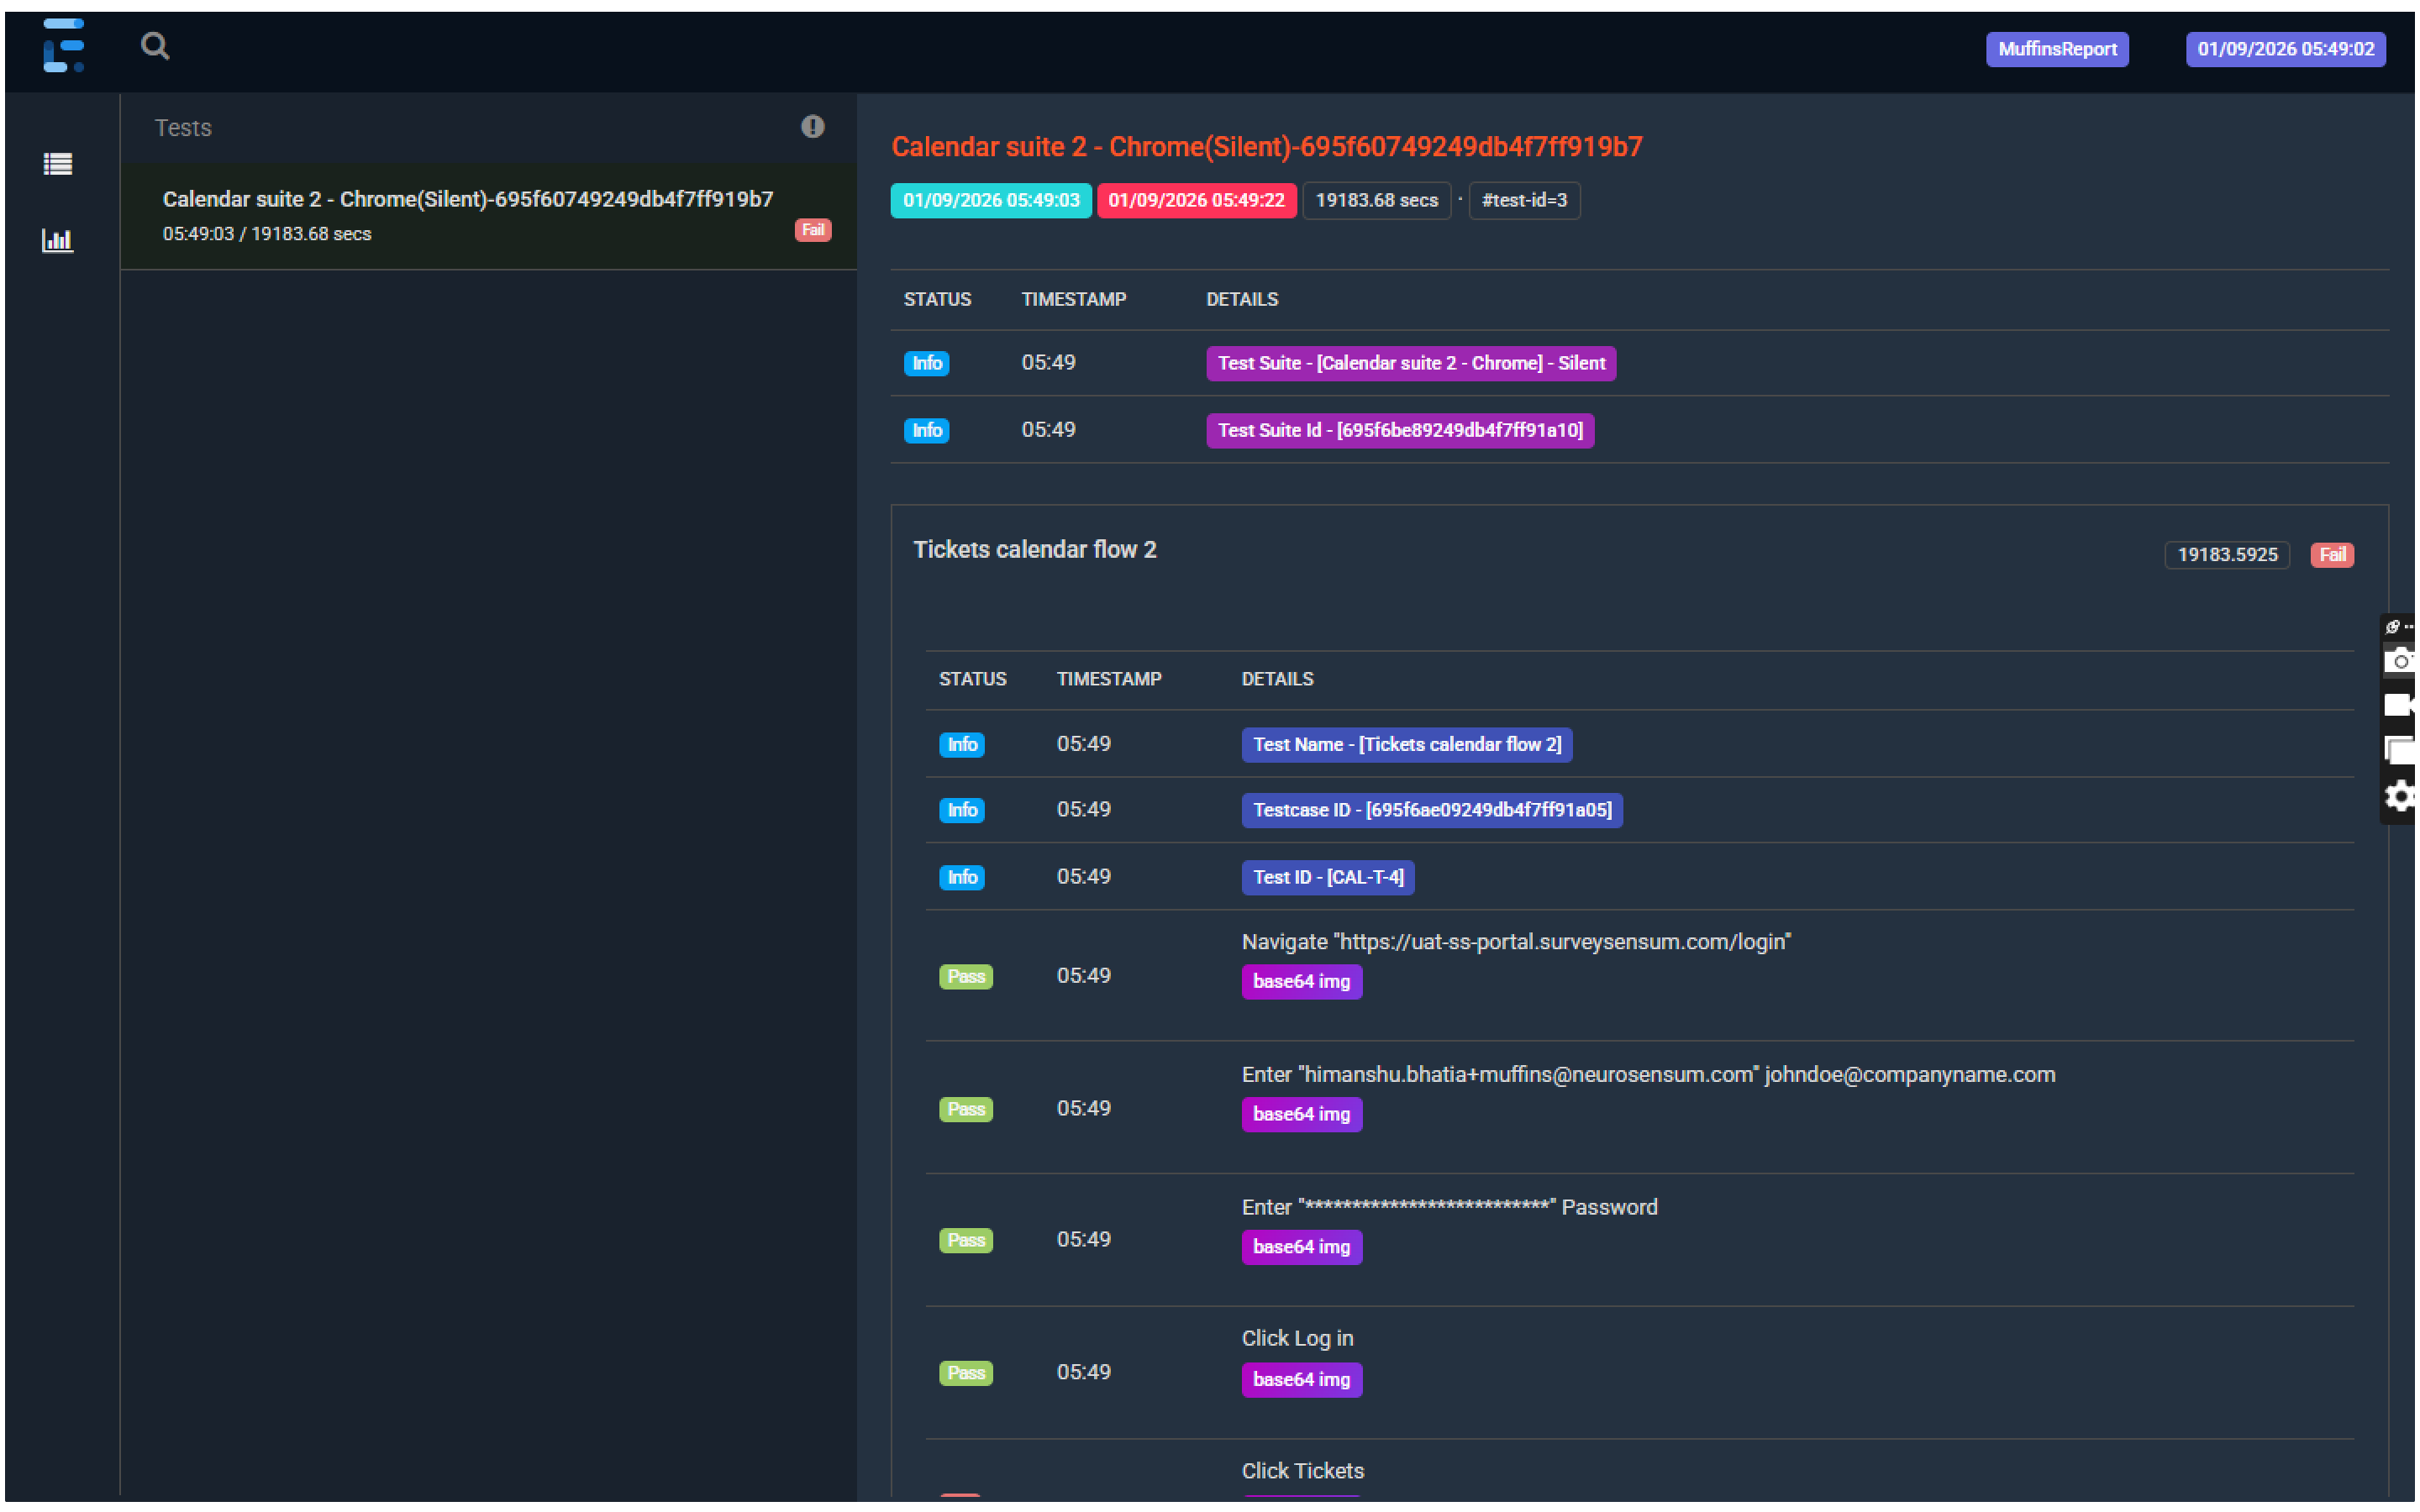
Live Execution Dashboards
- Watch test results stream in real-time. See pass/fail status instantly.
- Monitor execution across all environments simultaneously.
.png)
Full Requirements Traceability
- Every requirement is linked to its tests, results, and defects.
- Visual coverage maps show what's tested, what's passing, what's at risk. In the traceability report user can see the linked requirement and linked defect.
Trend Analysis
- Track quality evolution over time. Compare today's build to yesterday's, this sprint to last sprint.
- Spot erratic trend immediately.
.png)
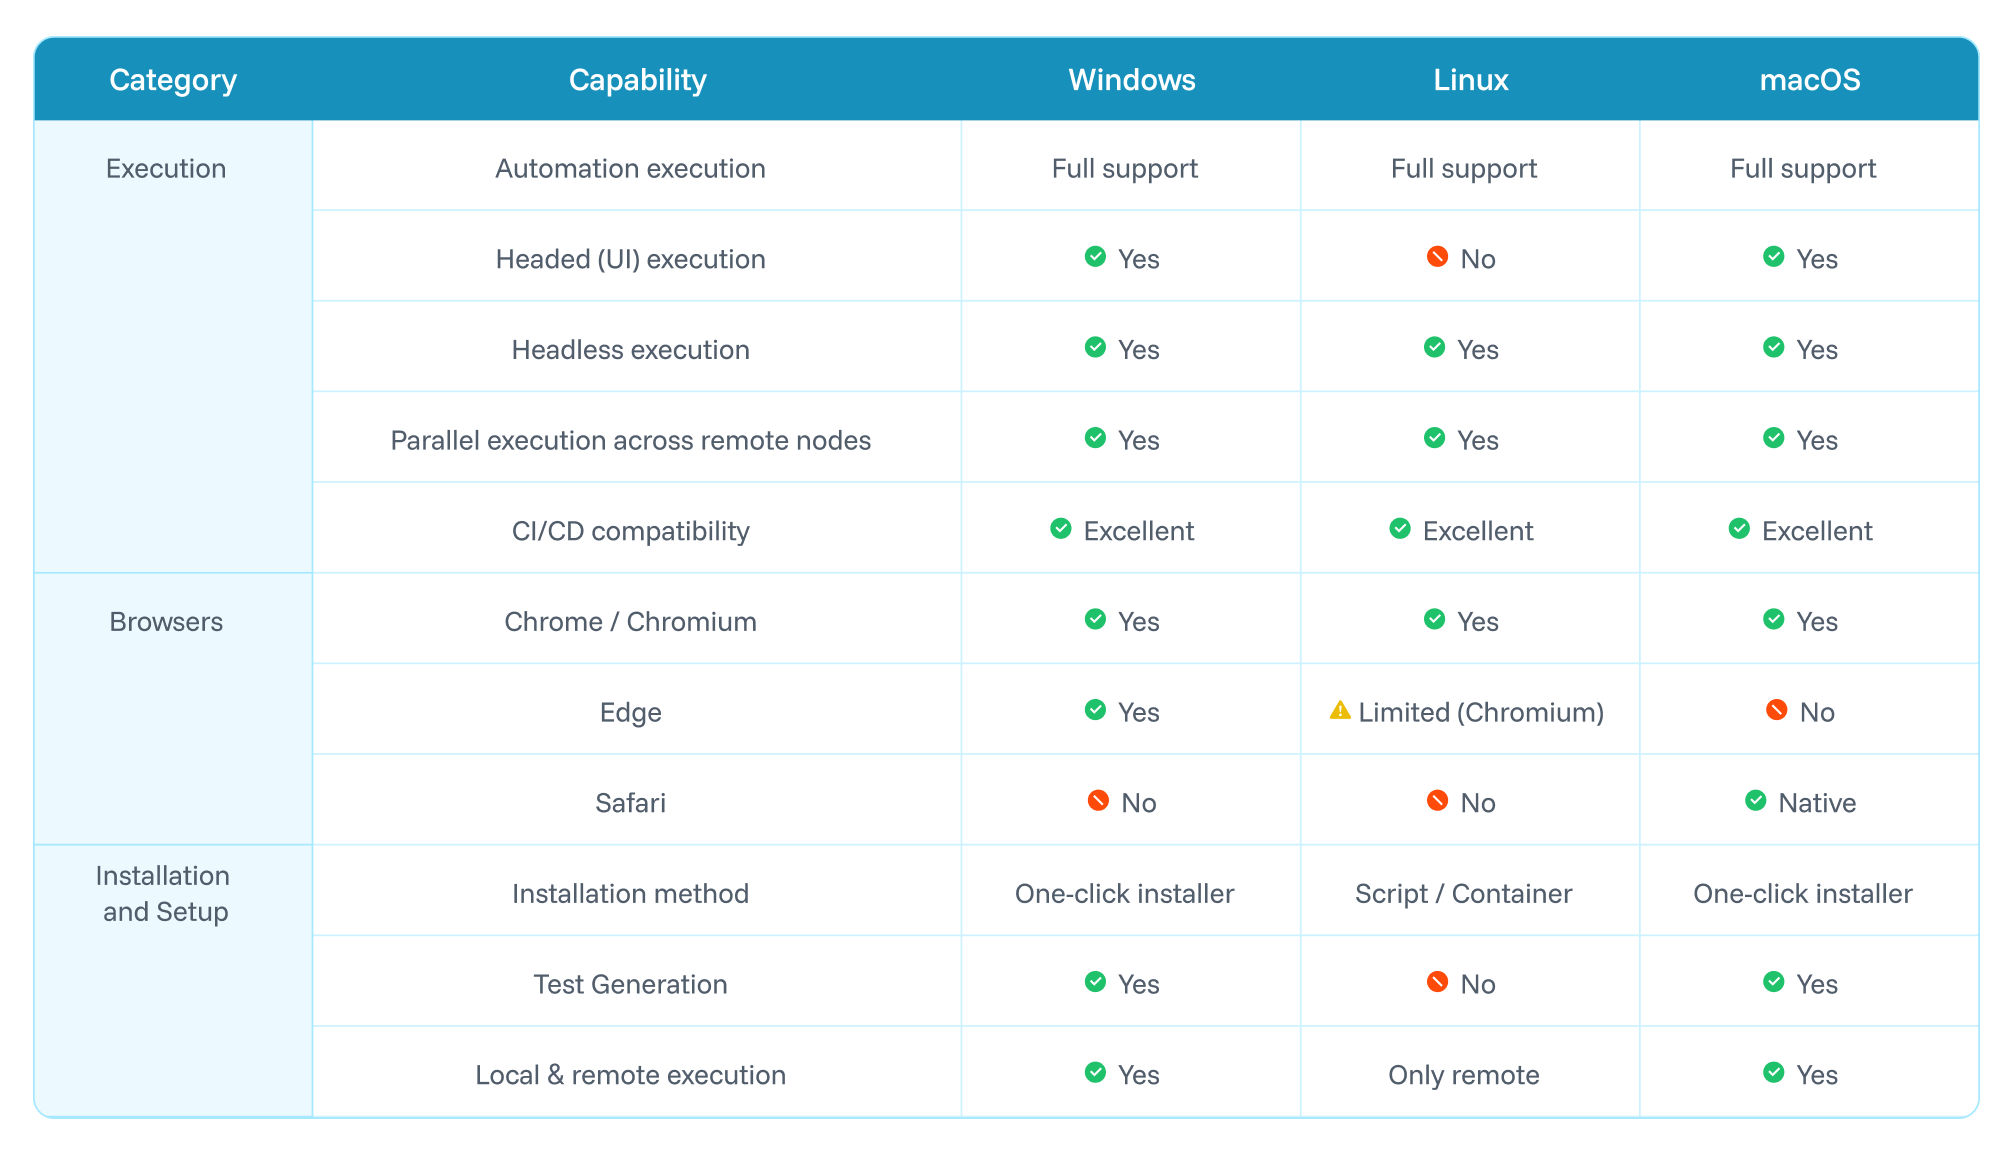
Cross-Environment Comparison
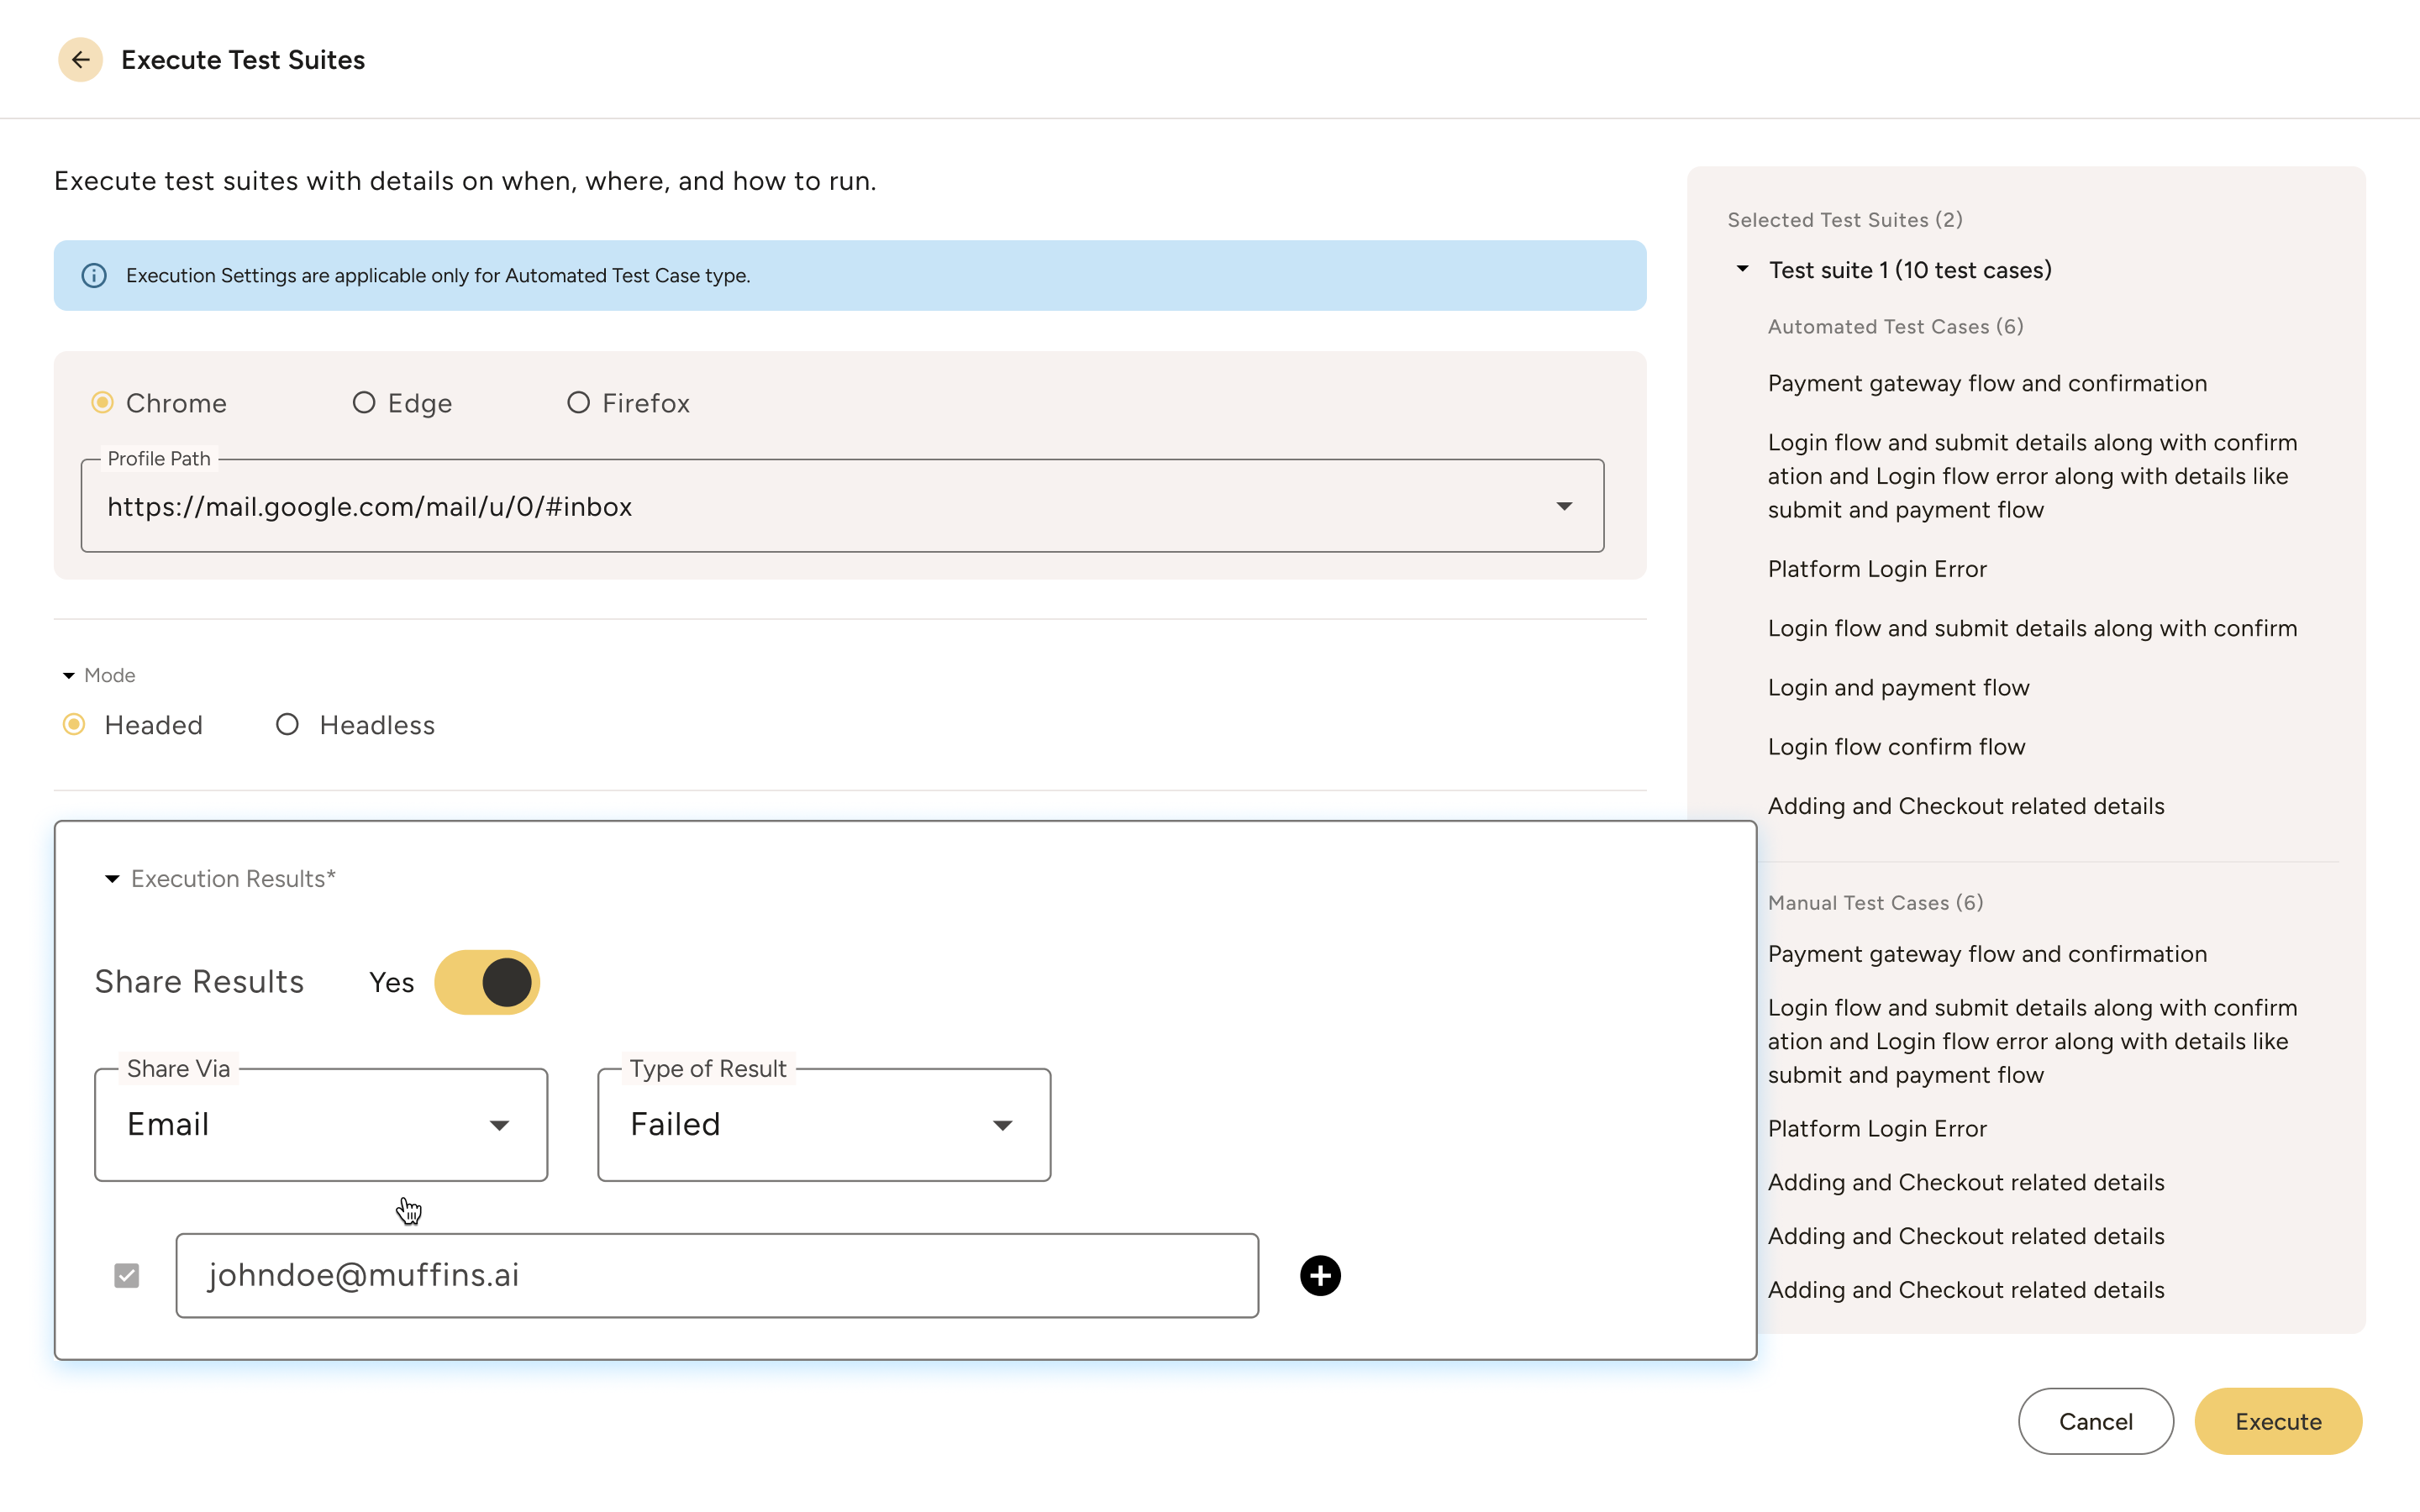
Automated Stakeholder Reports
.png)
Join QA teams who deliver reliable software 3x faster every sprint


FAQs
Frequently asked questions
(01)
How frequently do dashboards update?
Real-time means real-time. Test completes, dashboard updates. Usually within 2-3 seconds. No batch processing delays.
(02)
Can we customize reports for different audiences?
Yes. Create templates for each stakeholder group. Technical details for developers, KPIs for executives, compliance data for auditors.
(03)
Do you support in generating test documents meeting our compliance requirements?
Reports are generated with Click of a button, e.g., test design, test execution, defects, traceability reports and more.
(04)
How do I access and visualize the analysis and reports?
Muffins Dashboard for detailed analysis, and reports can be shared and viewed over Email, Whatsapp, Teams and Slack.